SSIS, SSRS, SSAS- What’s the Right Order to Learn Microsoft’s BI Stack?

If you're stepping into the world of Microsoft Business Intelligence (BI), you've likely come across these three pillars:
- SSIS (SQL Server Integration Services)
- SSRS (SQL Server Reporting Services)
- SSAS (SQL Server Analysis Services)
But here’s the big question: In what order should you learn them?
This post breaks down what each tool does, why the order matters, and how to strategically plan your learning path especially if you're aiming to become a BI Developer, Data Engineer, or Analytics Consultant.
The Microsoft BI Stack: What Does Each One Do?
Before we talk about learning order, here’s a quick breakdown:
| Tool | Purpose | Use Case |
|---|---|---|
| SSIS | ETL (Extract, Transform, Load) | Moving and transforming data from sources into SQL Server or a data warehouse |
| SSRS | Operational / Paginated Reporting | Generating and delivering reports (PDF, Excel, web) to business users |
| SSAS | Analytics Modeling | Building semantic models (OLAP cubes or Tabular models) for advanced analysis |
Recommended Learning Order
Step 1: Start with SSIS (SQL Server Integration Services)
“You can’t analyze or report on data that doesn’t exist yet.”
SSIS is your data pipeline tool. It teaches you how to extract, cleanse, and load data from various sources (CSV, Excel, APIs, other databases) into your data warehouse or reporting database.
What You’ll Learn:
- Control Flow vs Data Flow
- Data transformations
- Error handling & logging
- File loops and automation
- Scheduling packages with SQL Server Agent
Why first? Everything else in BI depends on data being in the right place. SSIS gives you that foundation.
Step 2: Learn SSRS (SQL Server Reporting Services)
Once the data is clean and available, it's time to make it visible to stakeholders.
SSRS is a powerful tool for creating operational reports, like:
- Monthly sales statements
- Invoices
- Detailed data extracts
- Dashboards with parameters and filters
What You’ll Learn:
- Building reports using SQL queries
- Grouping, sorting, and aggregating data
- Drill-down reports
- Subreports and expressions
- Report scheduling and subscriptions
Why second? It's simpler than SSAS and directly depends on having your data ETL'd via SSIS.
Step 3: Finish with SSAS (SQL Server Analysis Services)
SSAS is the most advanced of the three. It’s used to build semantic models that power analytics in tools like Power BI, Excel, or custom dashboards.
There are two main modes:
- Tabular Model (modern, DAX-based)
- Multidimensional Model (legacy, MDX-based)
What You’ll Learn:
- Designing star schemas
- Creating measures, KPIs, and hierarchies
- DAX (Data Analysis Expressions) or MDX
- Security, partitions, processing
Why last? It requires a solid understanding of clean, well-modeled data which you get through SSIS. Plus, it's more abstract and modeling-heavy.
Summary: Visual Learning Path
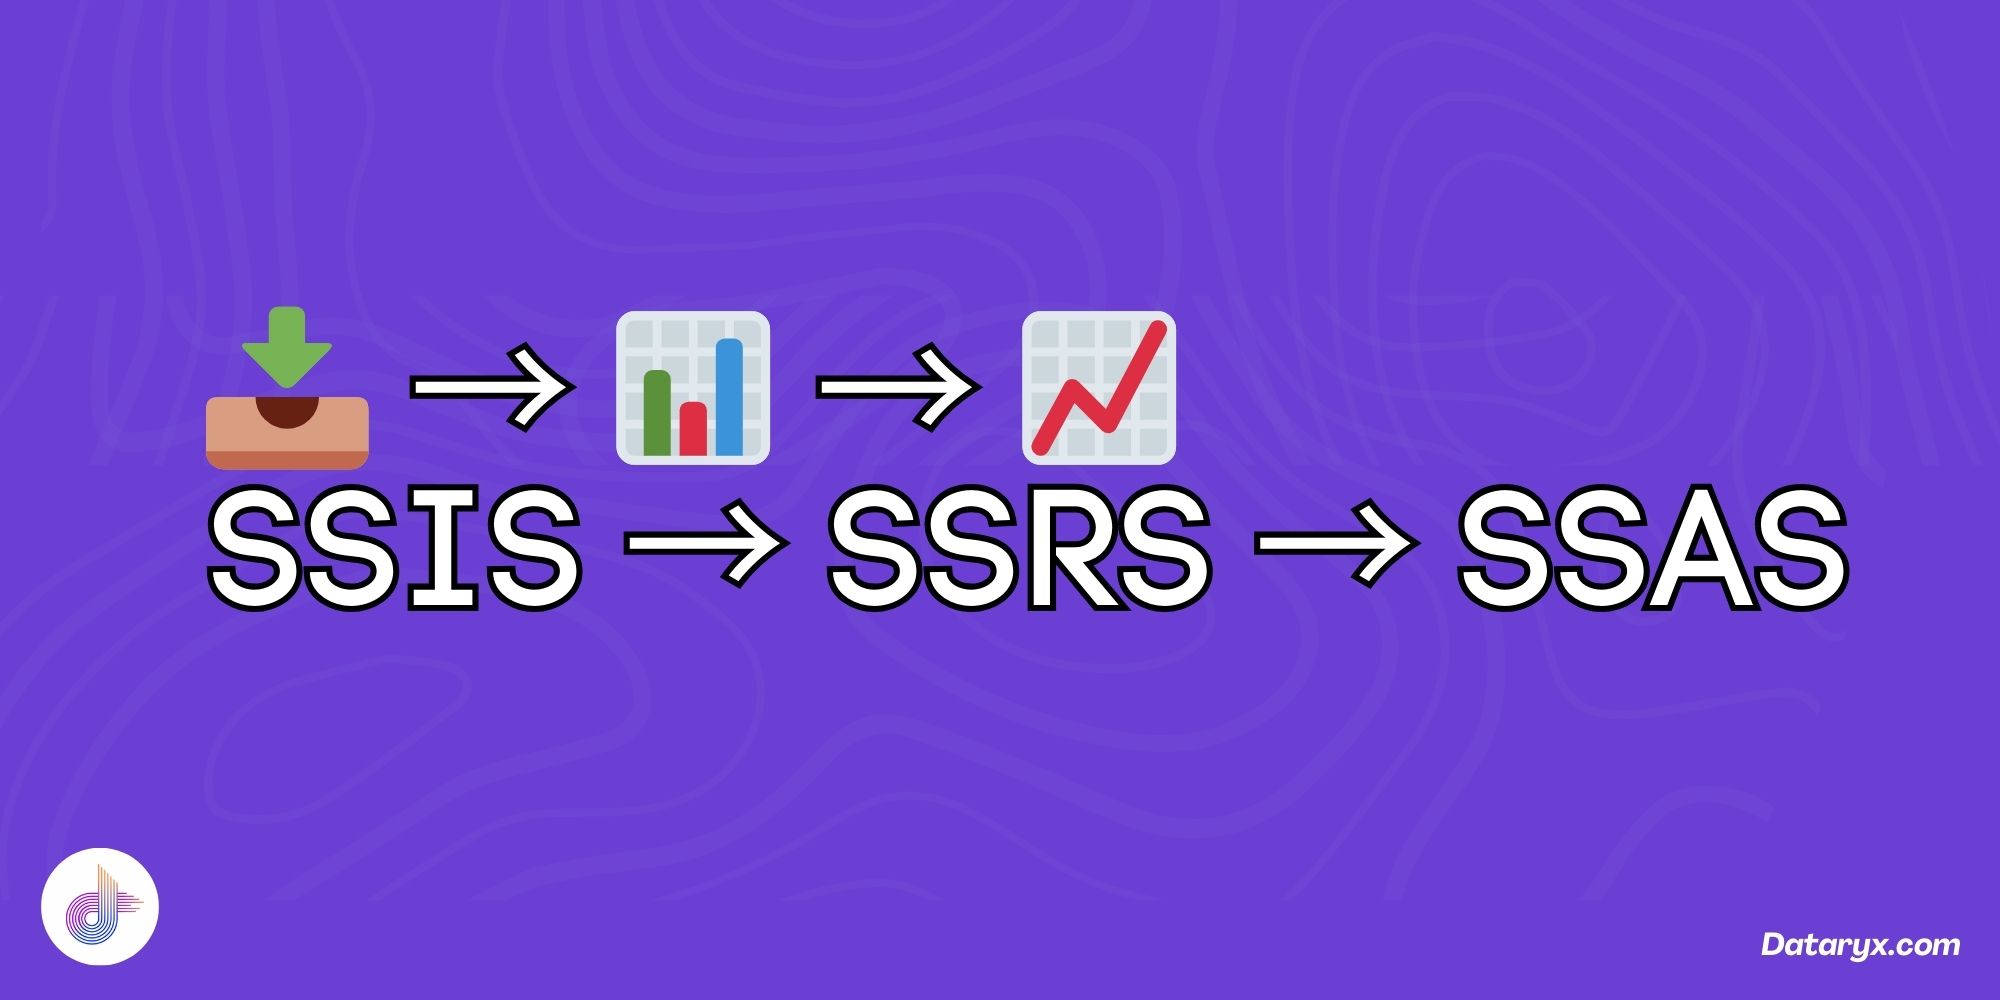
📥 SSIS → 📊 SSRS → 📈 SSAS
Extract & Load → Report → Analyze & Model
Role-Based Guidance
| Career Path | Focus Priority |
|---|---|
| BI Developer | SSIS → SSRS → SSAS (All are important) |
| Data Engineer | Deep SSIS, light SSAS |
| Data Analyst / Power BI Developer | SSAS (Tabular), light SSRS |
| ETL Developer | SSIS-focused, basic SSRS |
Suggested Time Investment
| Tool | Time to Learn | Suggested Depth |
|---|---|---|
| SSIS | 2–3 weeks | Intermediate |
| SSRS | 1–2 weeks | Basic to Intermediate |
| SSAS | 3–4 weeks | Intermediate to Advanced |
Final Thoughts
If you're learning Microsoft’s BI stack from scratch, the most effective and logical path is:
👉 Start with SSIS to understand how data flows.
👉 Move to SSRS to learn how to present the data.
👉 Graduate to SSAS to unlock advanced analytics and semantic modeling.
This progression mirrors how real-world BI solutions are built from raw data to clean reporting to high-level analytics.